


- All
- TUTORIALS
- TIPS & TRICKS
- NEW FETAURES

Maximizing Connectivity for Geological Discovery & Interpretation
Part One: Discovery

Maximizing Connectivity for Geological Discovery & Interpretation
Part Two: Interpret & Integrate

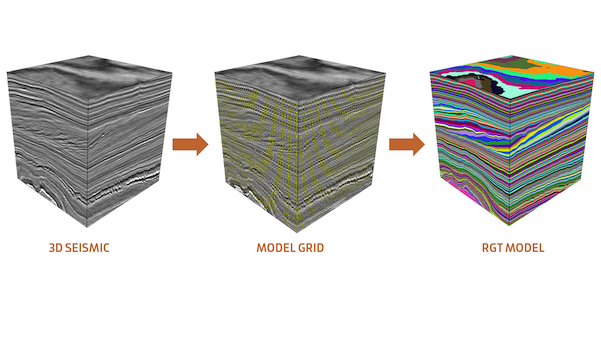
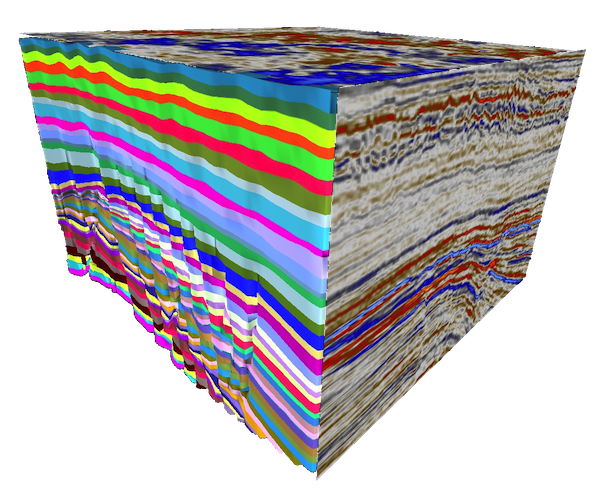
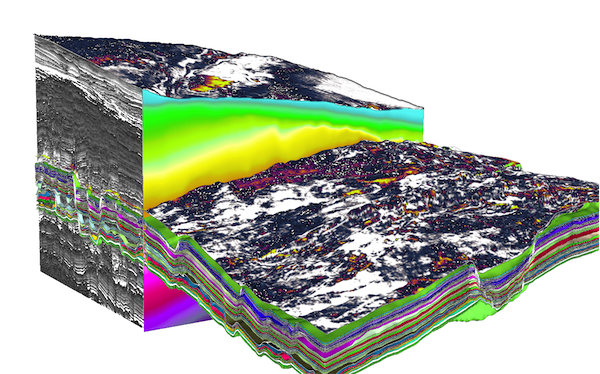
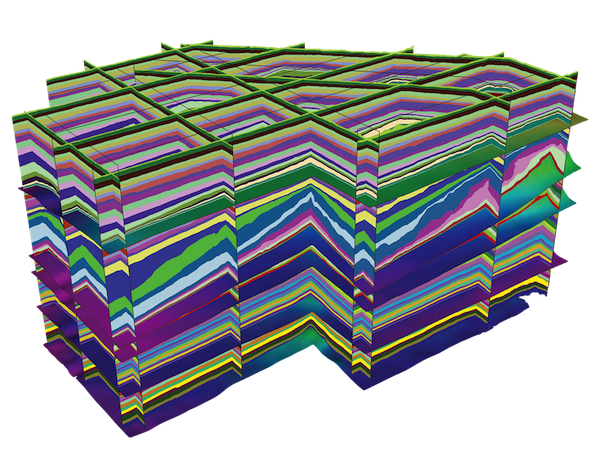
PaleoScan™ Relative Geological Time Model Creation and Editing
Paleoscan 2023 Tutorial

How to tweak your Spectral Decomposition?
Paleoscan Tips & Tricks

Gallery Item Name
Lorem ipsum dolor sit amet, consectetur adipisicing elit. Quidem, provident.
Unfortunately, we don’t have a silent installer available from our website. But here is another way to install PaleoScan silently on your machines, from the command prompt:
Use the following syntax: paleoscan.exe /S /D=C:\destination_folder
You may want to use the same arguments for the uninstall executable: uninstall.exe /S
Let us know if this helps.
The version of the Petrel Data Connector that you should use depends on both your version of Petrel and your version of Paleoscan. For example, if you are using Paleoscan 2023.x.x and Petrel 2022 you should use the “PaleoScan 2023-Petrel 2022” version of the connector.
You can find the different versions of the PaleoScan connectors just here https://www.eliis-geo.com/connect-a.html
For each version of Paleoscan, we officially support connectors for the versions of Petrel of the same year and for the previous year’s Petrel version. Exceptionally, we may release connectors for older versions of Petrel.
Unsupported versions of the connector (e.g. when the Petrel version is more recent than the Paleoscan version, or when there is more than two years difference between both versions) may work and facilitate the transfer of data between Petrel and Paleoscan, however, we do not guarantee the integrity of the transfer in such scenarios. When attempting to use a connector in an unsupported scenario, you should always take Petrel’s version as reference.
For example:
- If you work with PaleoScan 2021 and Petrel 2019, the Data Connector you should use is “Petrel 2019 ← → PaleoScan 2020”
- If you work with PaleoScan 2019 and Petrel 2021, the Data Connector you should use is “Petrel 2021 ← → PaleoScan 2021”
PaleoScan runs on PCs, laptop, desktop or workstation. PaleoScan does not run on Mac computers. PaleoScan can also run on Virtual Machines.
PaleoScan requires Windows 64-bit version 7 or above.
The minimum /recommended hardware configuration to run PaleoScan is:
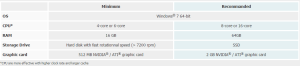
The recommendation for the percentage of physical memory allocated to PaleoScan is to keep the 30% default value for a machine with at least 16GB of RAM.
The “Temporary Directory” stores intermediate volumes computed by PaleoScan. The “Temporary Directory” does not need to be at the same location than the PaleoScan project and can be set by the user. It must however have at least 3 times the size of the seismic volume of free space.
Lorem ipsum dolor sit amet, consectetur adipisicing elit. Optio, neque qui velit. Magni dolorum quidem ipsam eligendi, totam, facilis laudantium cum accusamus ullam voluptatibus commodi numquam, error, est. Ea, consequatur.